


Reaching $31,000 on April 14, Bitcoin has been volatile since then. In this process, BTC, which pinned under $ 26,000, rose to $ 29600 during the day.
While BTC continues its volatile movements, Valkyrie Investments analysts have studied Bitcoin's price movements.
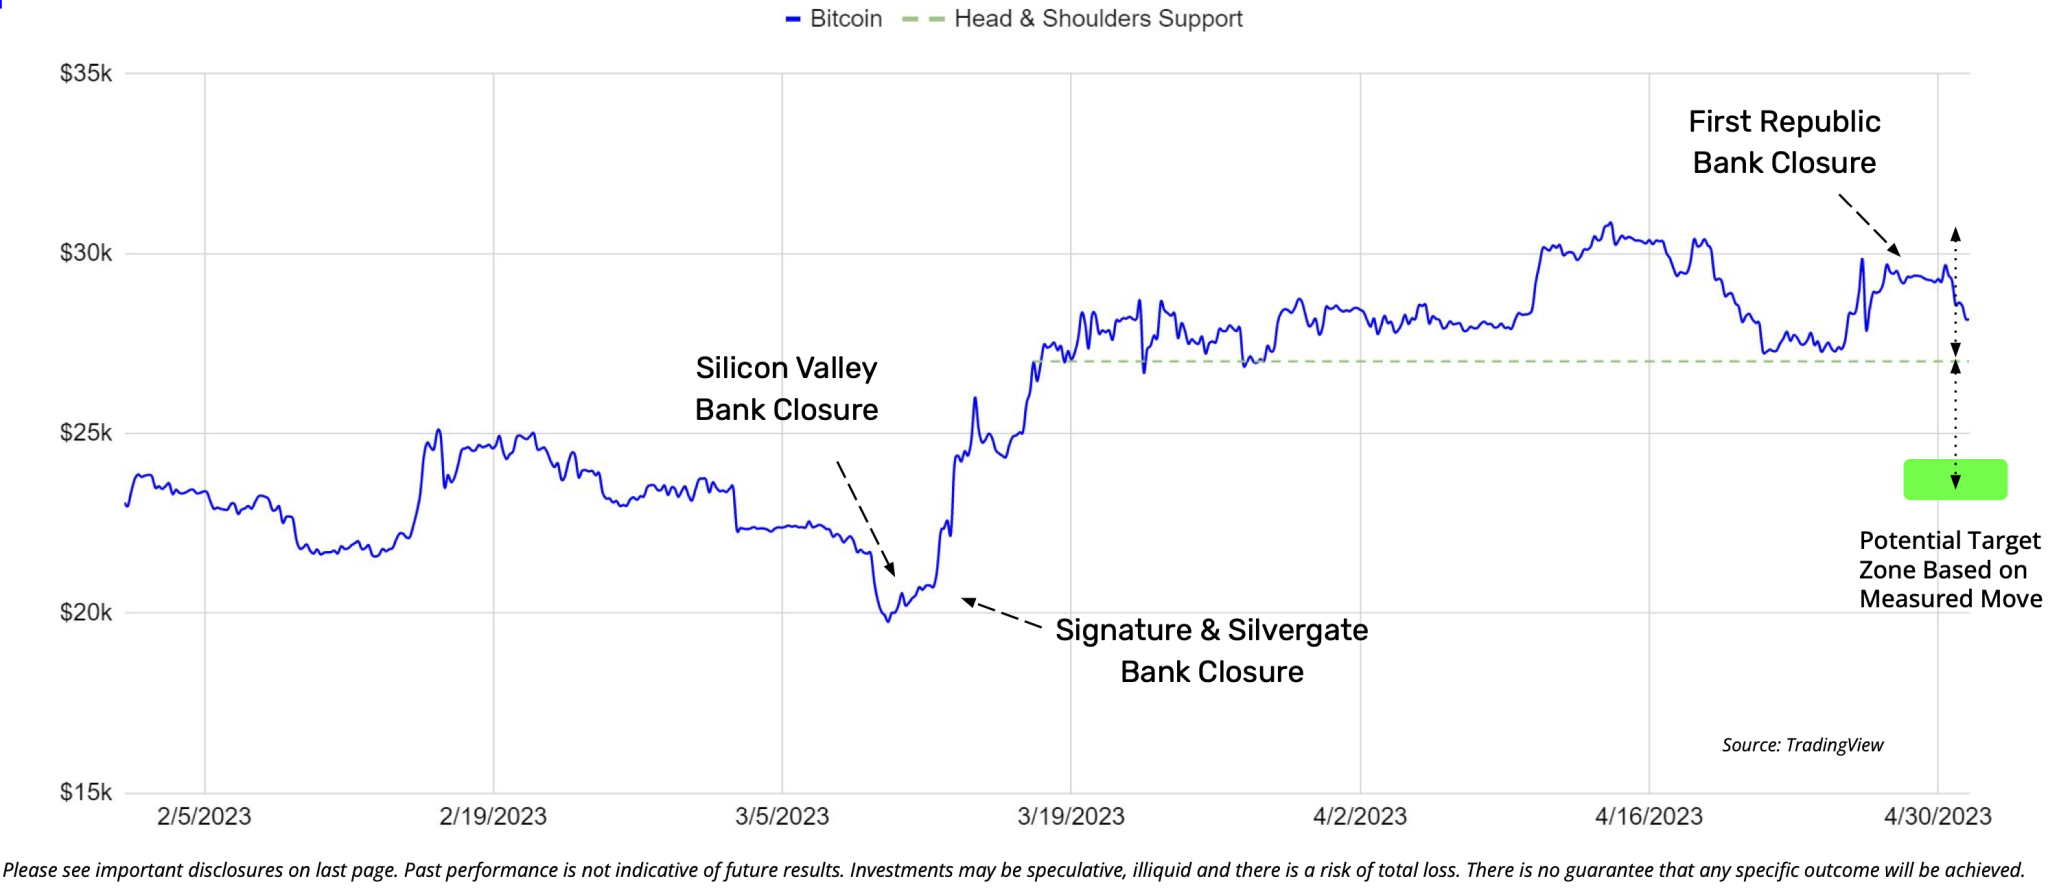
Analysts said that BTC has formed a "head-and-shoulder" pattern of price action since March 19, although it did not fully meet the criteria.
Analysts see this pattern as a sign of an upcoming bullish to bearish transition in BTC.
The analysts of Valkyrie, led by Steven McClurg, included the following statements in their report:
“A head and shoulders pattern has emerged on Bitcoin's daily chart, signaling near-term distress for the leading cryptocurrency.
Long-term trend metrics in BTC remain firmly bullish, but a short-term bearish chart has formed.
Since March 19, BTC price action has drawn extreme highs and attempted lower highs, although the BTC chart does not quite meet the head-and-shoulder chart.
According to the chart, if Bitcoin price drops below the neckline, a $24,000 zone is possible depending on the measured depth of the pattern extending below the neckline.
In this context, traders often place bearish bets when prices fall below the trendline connecting the first and second troughs."
 *Not investment advice.