


As selling pressure intensified in the cryptocurrency market, the price of Bitcoin fell below the $80,000 level.
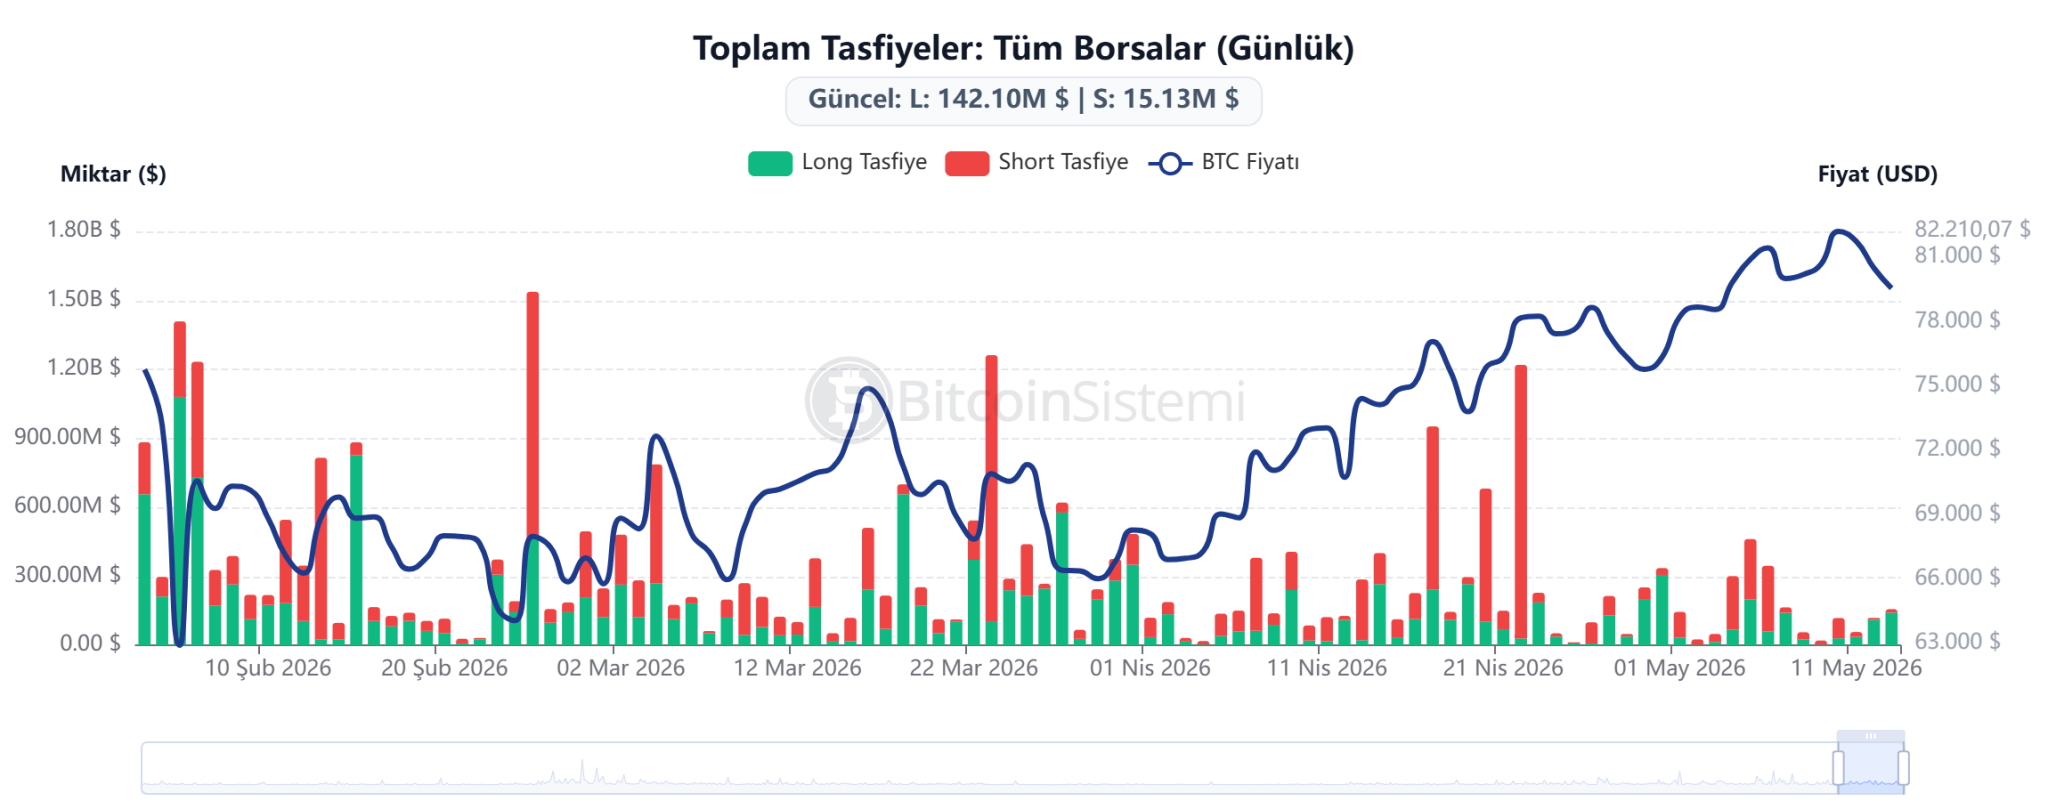
While Bitcoin traded at $79,650 in the last 24 hours, sharp liquidations were observed in the derivatives markets. According to the data, a total of $158.53 million worth of positions were liquidated in the last 24 hours, with $142.59 million of this being long positions. Short liquidations remained at $15.93 million. Thus, approximately 89.9% of the liquidations came from long positions, indicating a sudden panic selling in the market.

The atmosphere of fear in the market was also reflected in investor sentiment. The Fear and Greed Index, closely followed by the crypto market, fell to 42, moving into the “Fear” zone. The index was in the “Neutral” zone at 49 the day before, while the 21 level seen last month indicated the “Extreme Fear” phase.
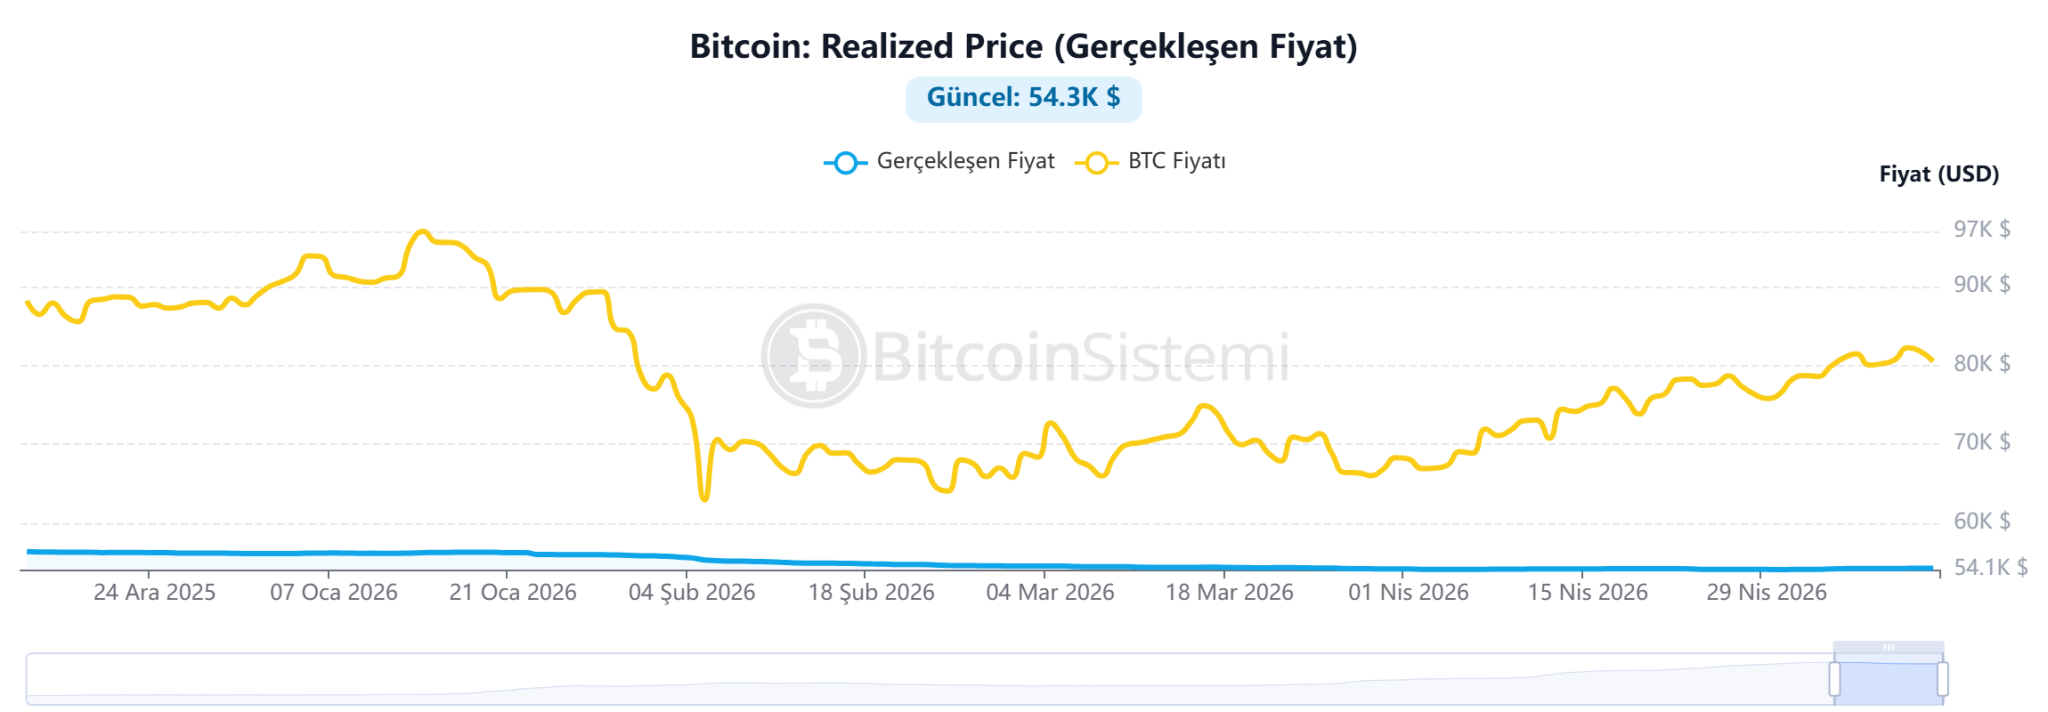
On-chain data, however, shows that despite the decline, Bitcoin has not completely lost its long-term bull market structure. Bitcoin’s “Realized Price” data is around $54,300. This metric represents the average cost level of investors in the market. The fact that the current price continues to stay above this level indicates that the market is still generally in profit-taking and that the cost levels of long-term investors constitute a significant support area.
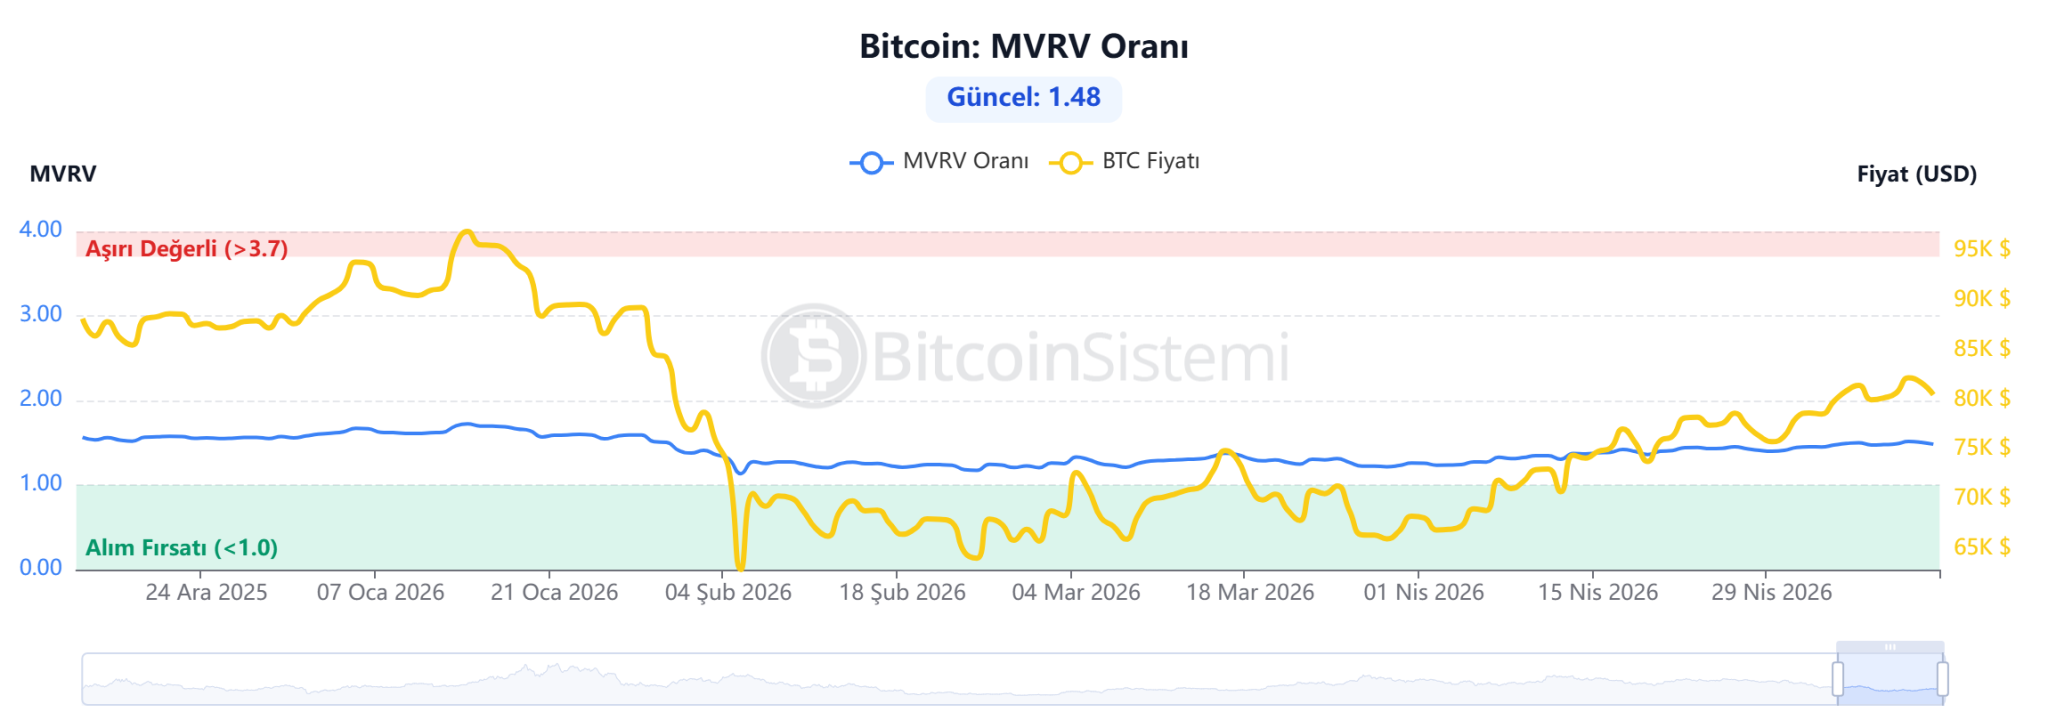
Bitcoin’s MVRV (Most Valuable Rate-to-Voltage) ratio was measured at 1.48. Historically, levels above 3.7 indicate overvaluation and bubble risk in the markets, while levels below 1 are associated with macroeconomic bottoms. Current levels suggest that the market is still far from the overexcitement zone and presents a more balanced picture compared to past cycles.
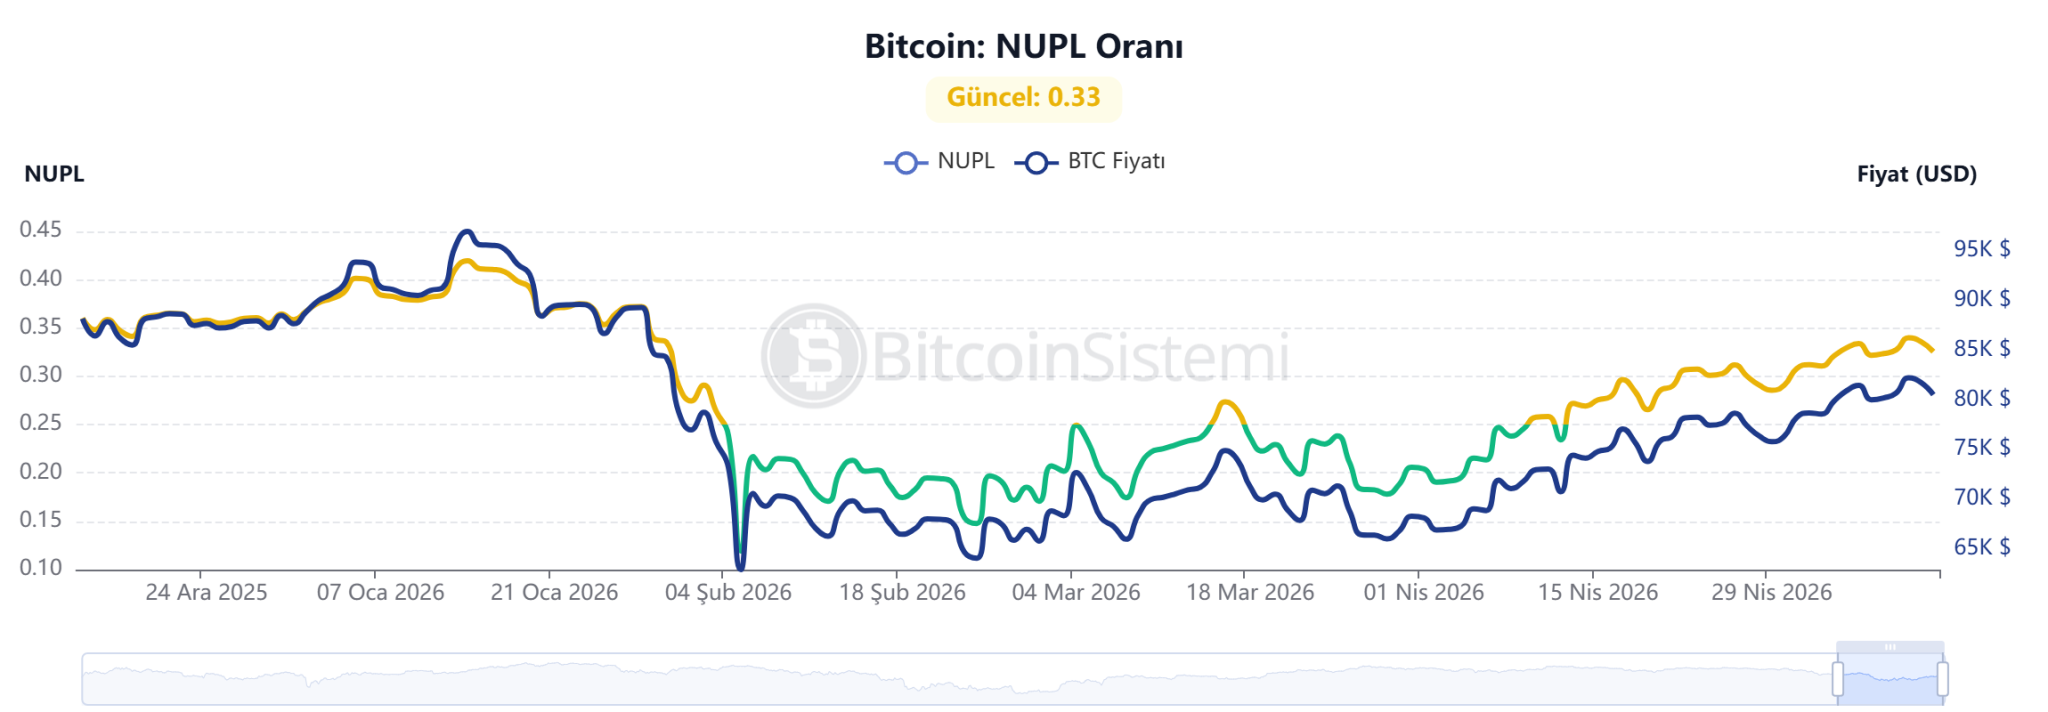
On the other hand, Bitcoin’s Net Unrealized Profit/Loss (NUPL) ratio is at 0.33. This data shows that a significant portion of investors are still in profit, but the market has not yet reached a phase of “excessive euphoria.”
*This is not investment advice.