


At Bitcoinsistemi.com, we offer you free access to the most important onchain tools.
You can click here to access all the onchain data tools we provide. Additionally, you can read our article below for a summary of the latest status of Bitcoin and other cryptocurrencies based on onchain data.

What is the State of Bitcoin and the Cryptocurrency Market According to Onchain Data?
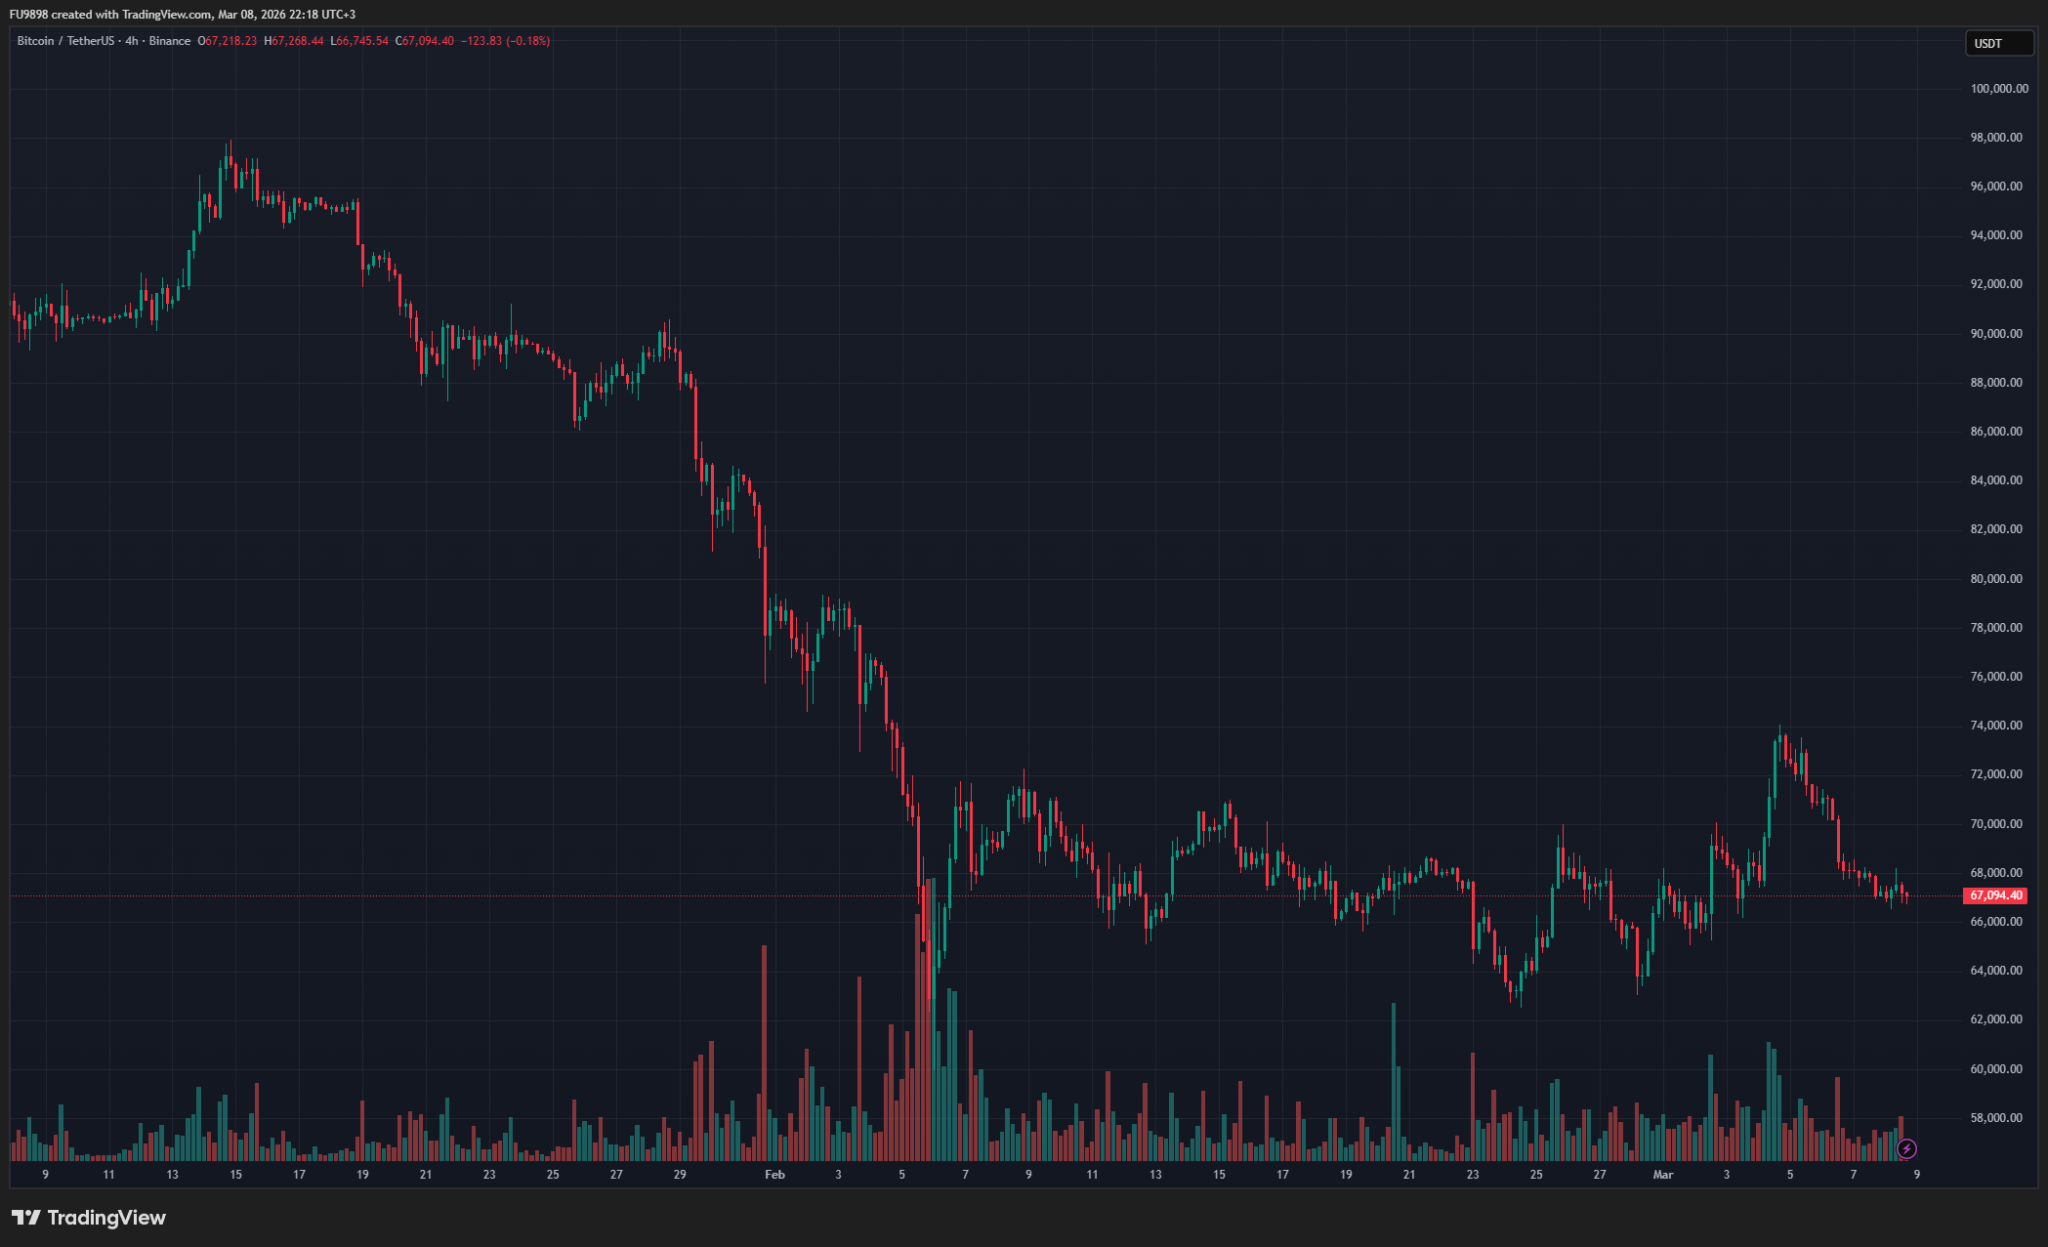
The Bitcoin price faces a complex picture indicated by both on-chain and derivatives market data.
According to the latest data, Bitcoin is trading at approximately $66,782, with a total market capitalization of around $1.34 trillion. The price has fallen by about 1.11% in the last 24 hours, and market indicators suggest that investor sentiment remains cautious.
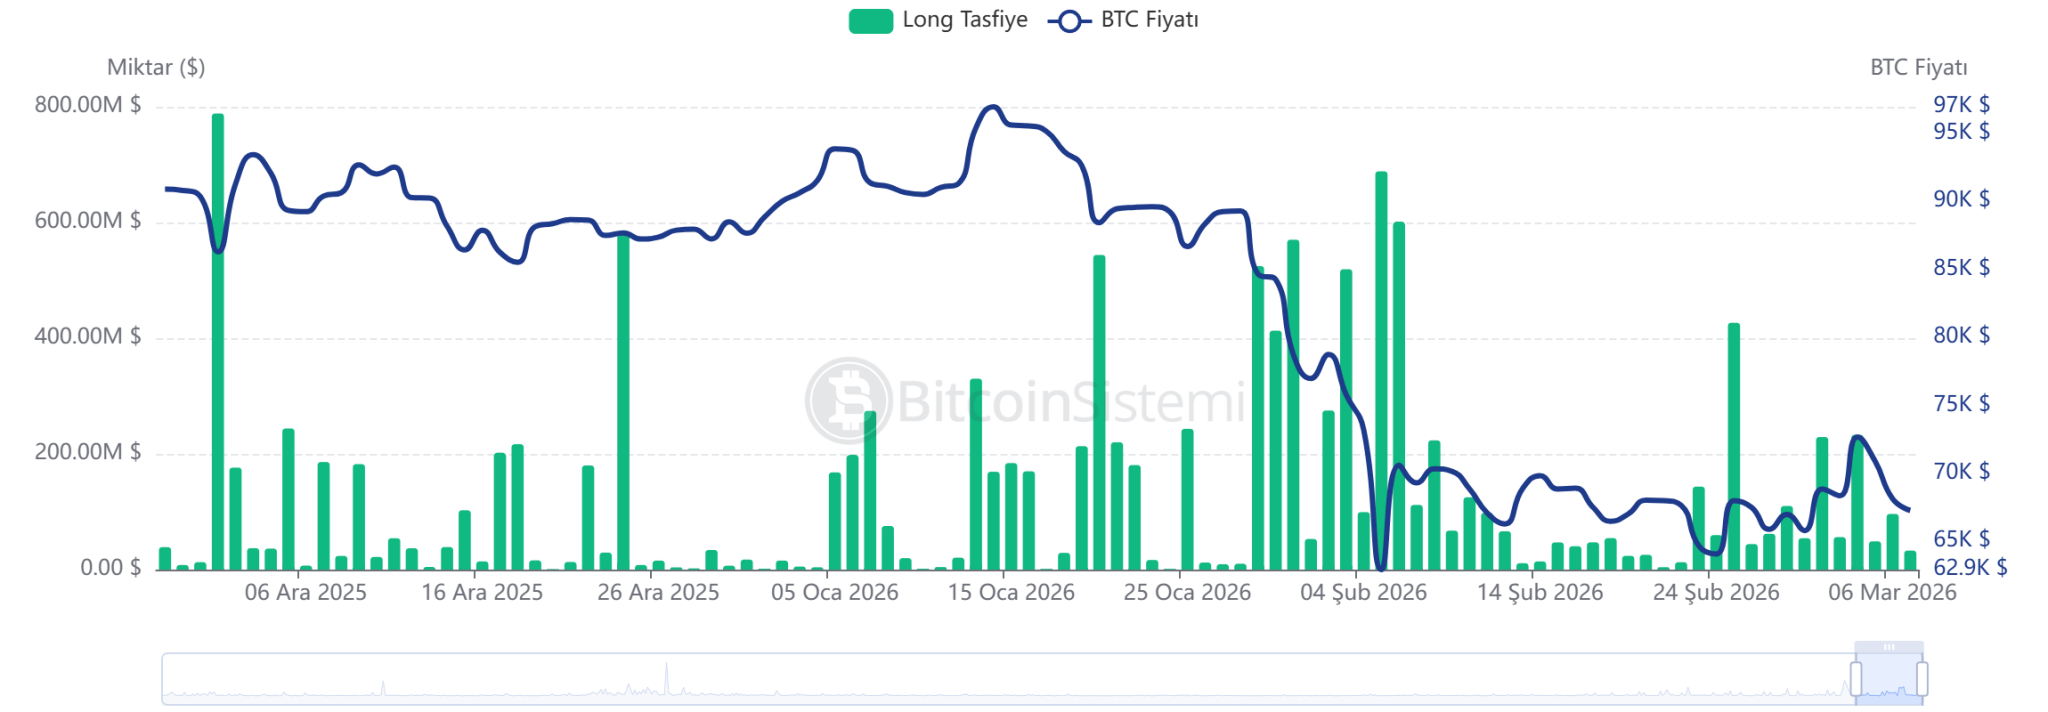
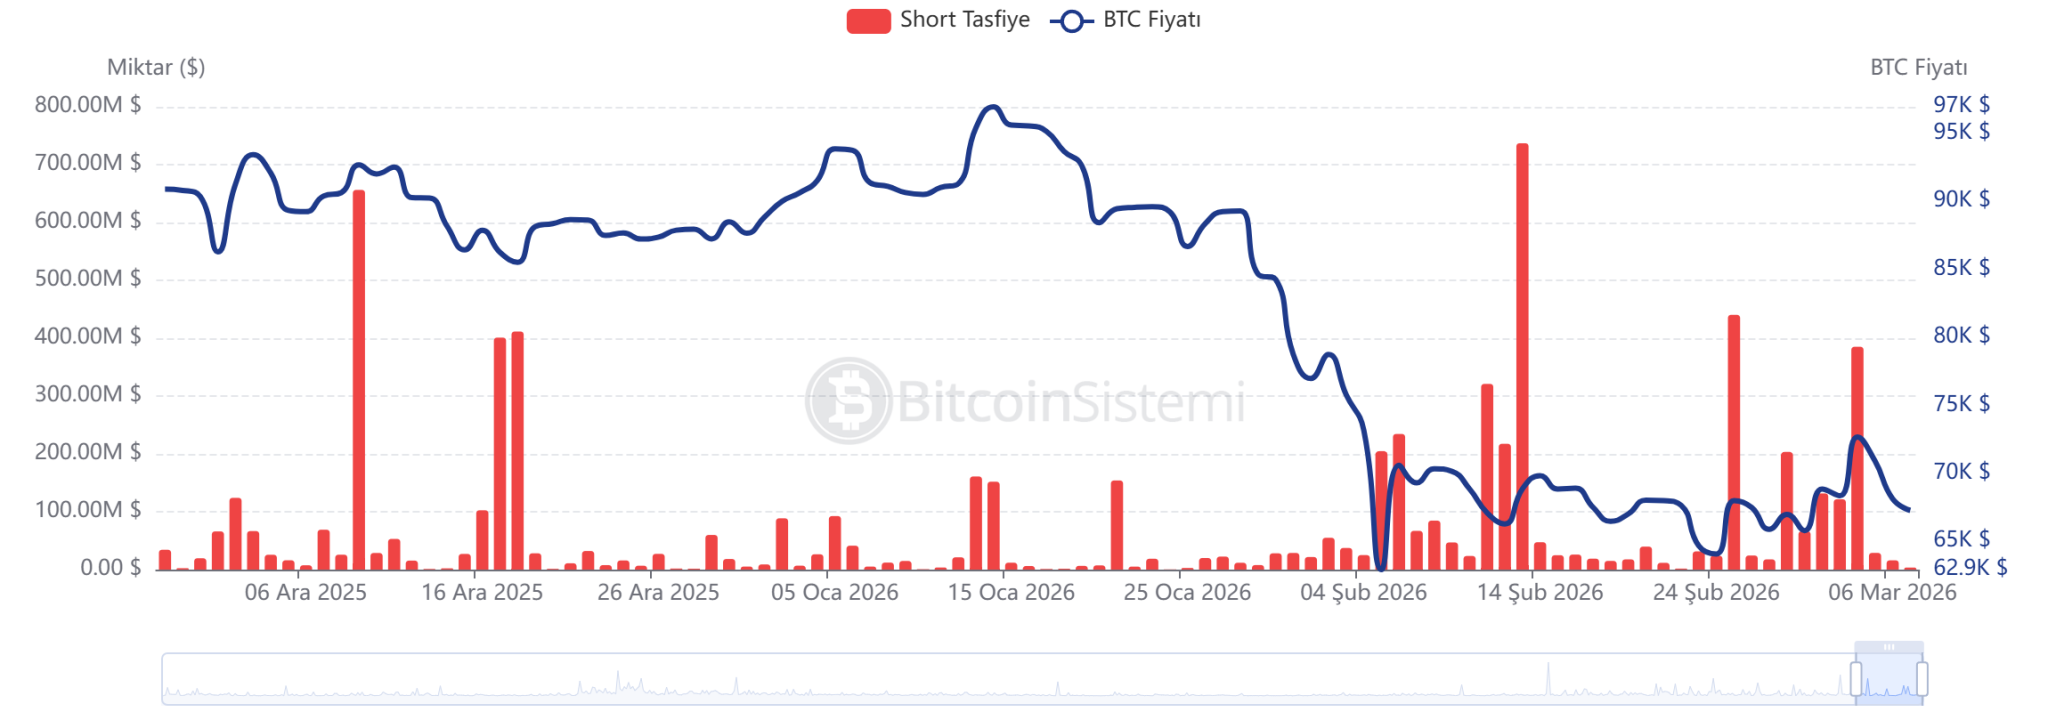
Liquidation data in derivative markets shows that long positions have predominantly suffered losses in recent hours. According to the data, a total of $24.15 million in long positions were liquidated recently, while $9.47 million in short positions were liquidated. This indicates that approximately 71.8% of the liquidations came from long positions. Typically, this type of data suggests that leveraged long positions are being cleared during periods when the price is under short-term downward pressure.
The Fear and Greed Index, which measures market sentiment, indicates that investor psychology is quite weak. The index is currently at 12, in the “Extreme Fear” zone.
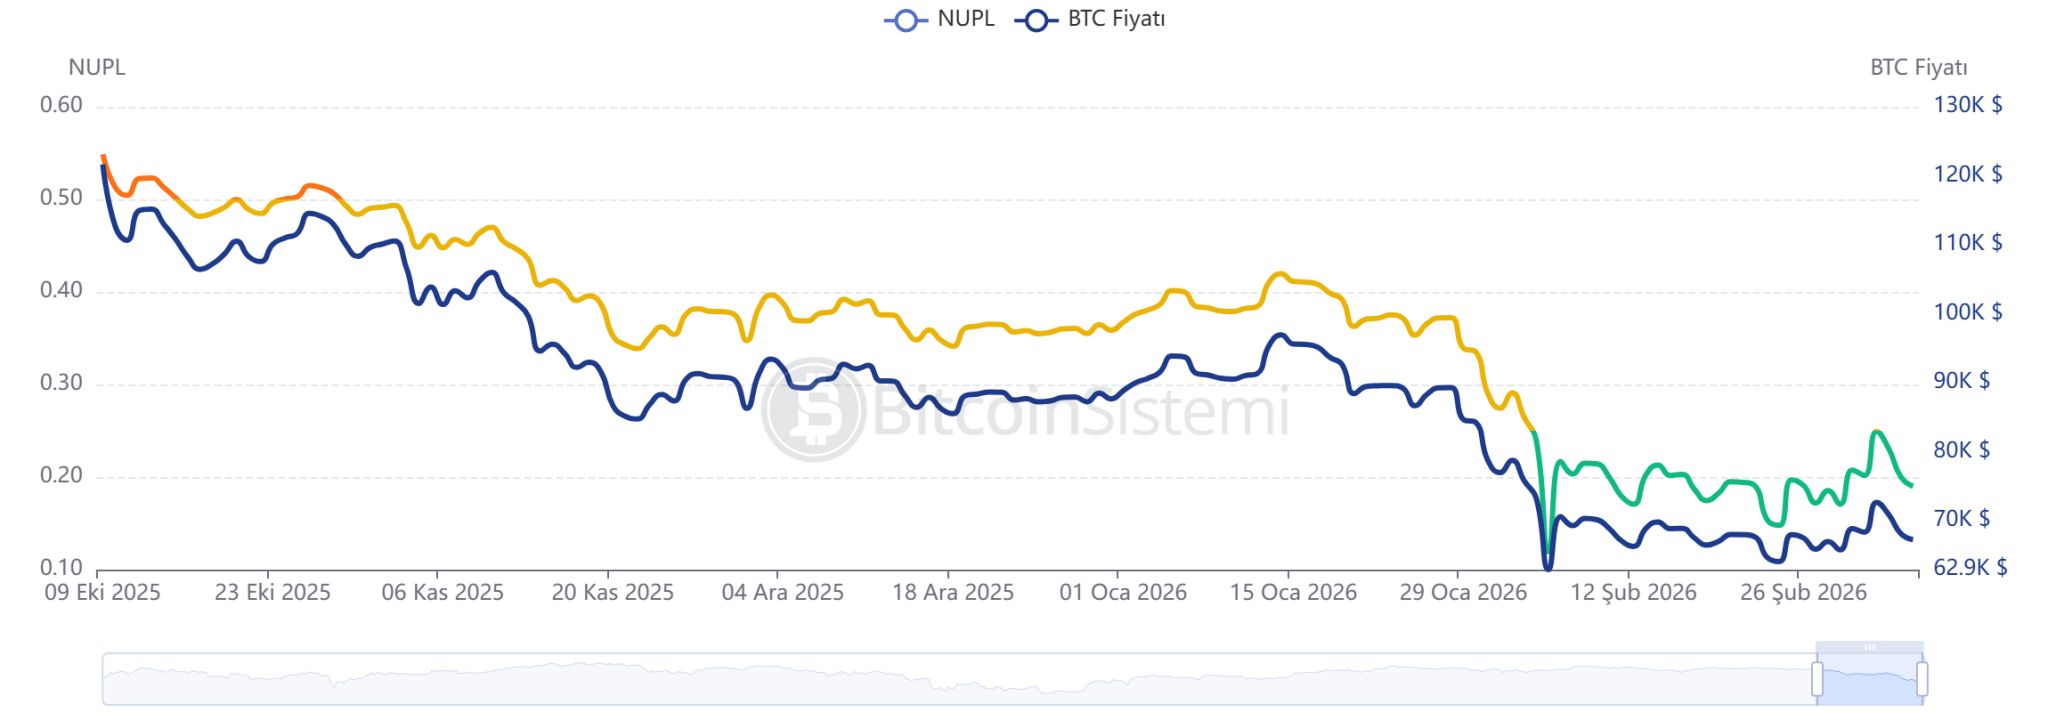
One of the on-chain profitability indicators, the Net Recognized Profit/Loss (NUPL) ratio, stands at 0.19. Since this value is above zero, it indicates that investors in the market are generally in profit. However, the fact that the NUPL value remains well below 0.7 suggests that the market has not yet reached the overprofit zone or the classic peak behavior. In other words, while investors are in profit, they are still far from the “euphoria” phase historically characterized by large sell-offs.
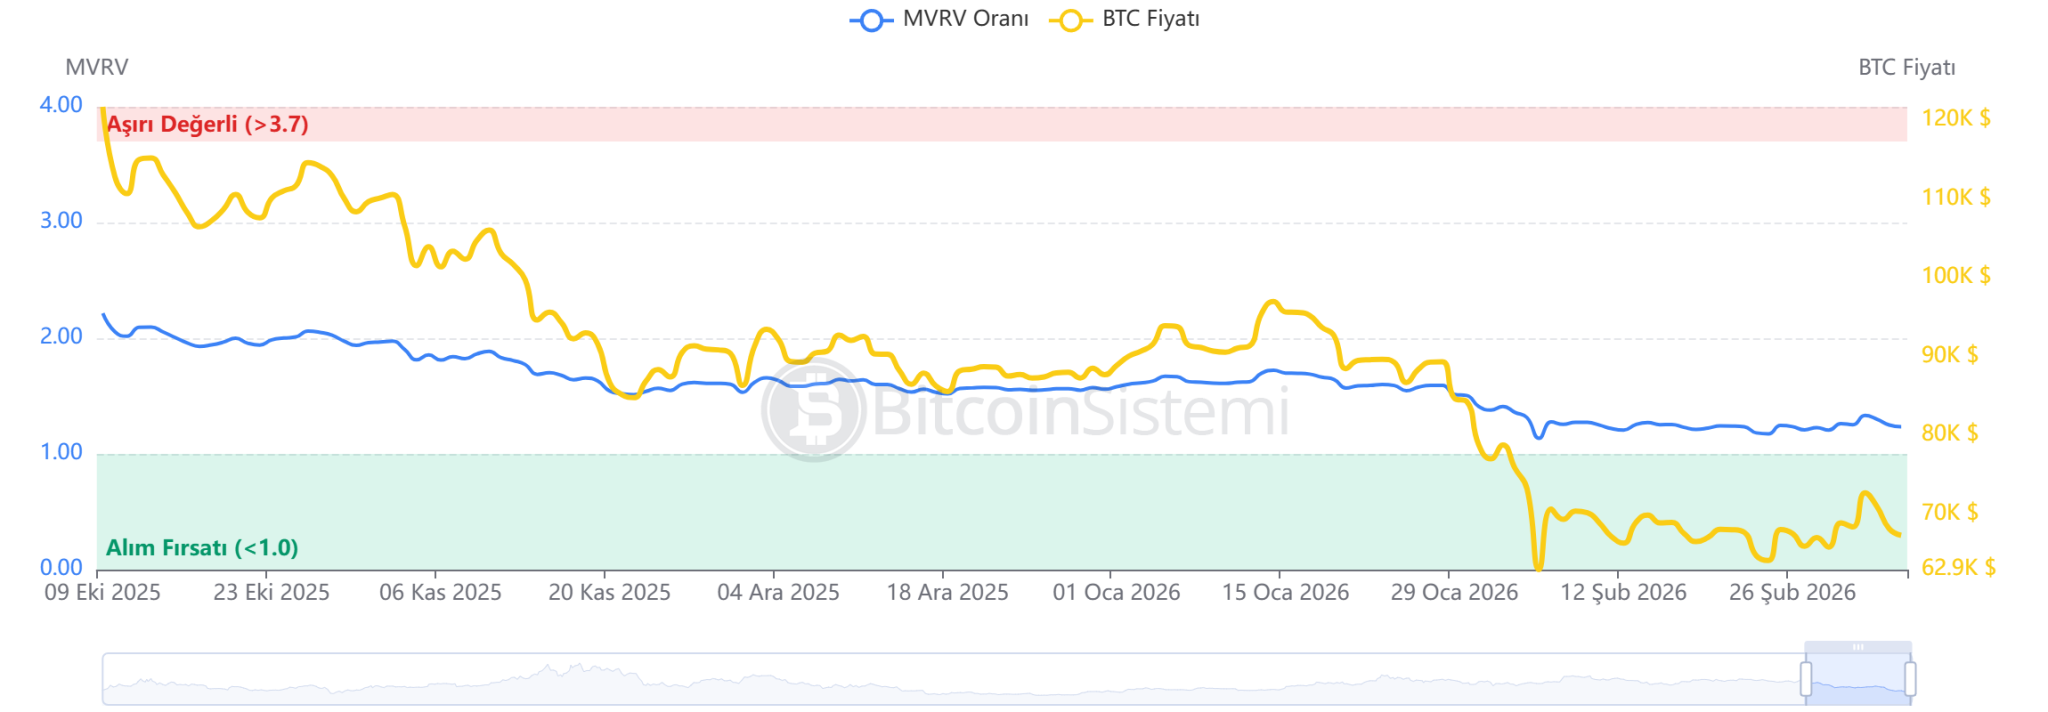
A similar pattern is observed in the MVRV ratio. Bitcoin’s MVRV is at 1.23. This ratio indicates that the Bitcoin price is approximately 23% above the average cost for investors. However, this value is still well below the 3.7 level, which is considered overvalued. Historically, this range generally signals the mid-cycle phase of the market or a healthy valuation zone.
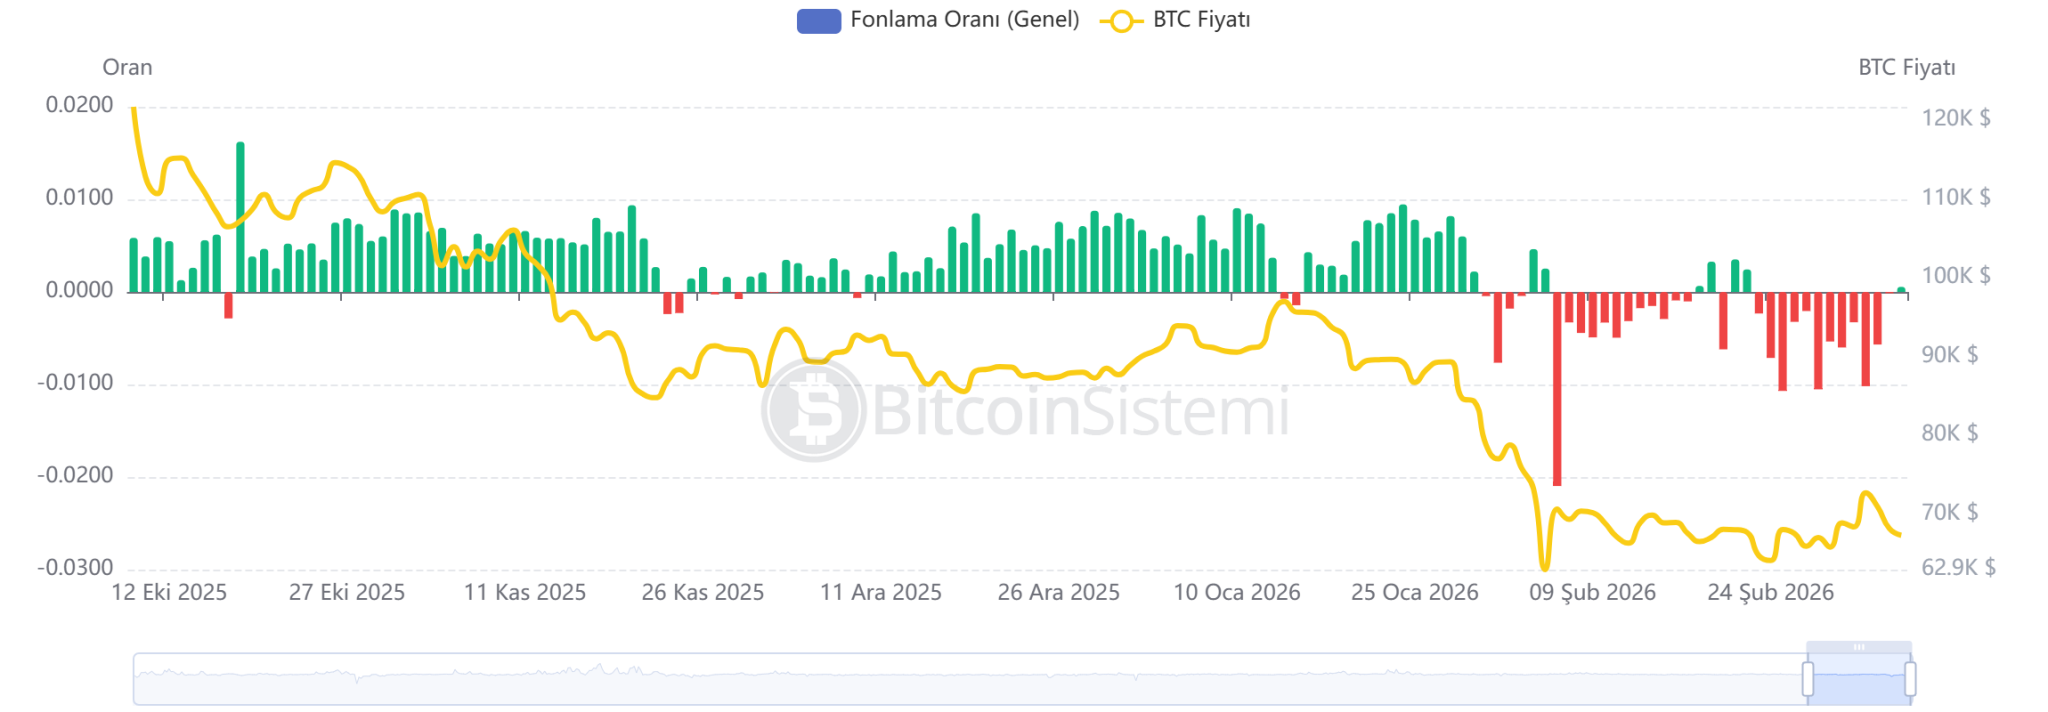
The funding rate in derivative markets is in the slightly positive region at 0.0005. A positive funding rate indicates that long positions are slightly more dominant than short positions in the market, and investors generally expect the price to rise. However, the relatively low level of the rate suggests that there is no expectation of an excessively leveraged rise and that the market exhibits a balanced structure.
*This is not investment advice.