




SummaryShowHideBitcoin fell 12.6% last week and dropped below its 200-week simple moving average, a long-term support indicator...
- Bitcoin fell 12.6% last week and dropped below its 200-week simple moving average, a long-term support indicator.
- In three earlier comparable declines, Bitcoin fell another 10% to 17% before recovering, but the recovery after June 2022 did not last.
Bitcoin lost 12.6% of its value last week, falling below its 200-week simple moving average (SMA), a long-term support indicator.
Bitcoin has fallen below its 200-week moving average four times since 2013, losing 12 percent or more on a weekly basis. Prior to the most recent drop, similar movements occurred in August 2015, March 2020, and June 2022.

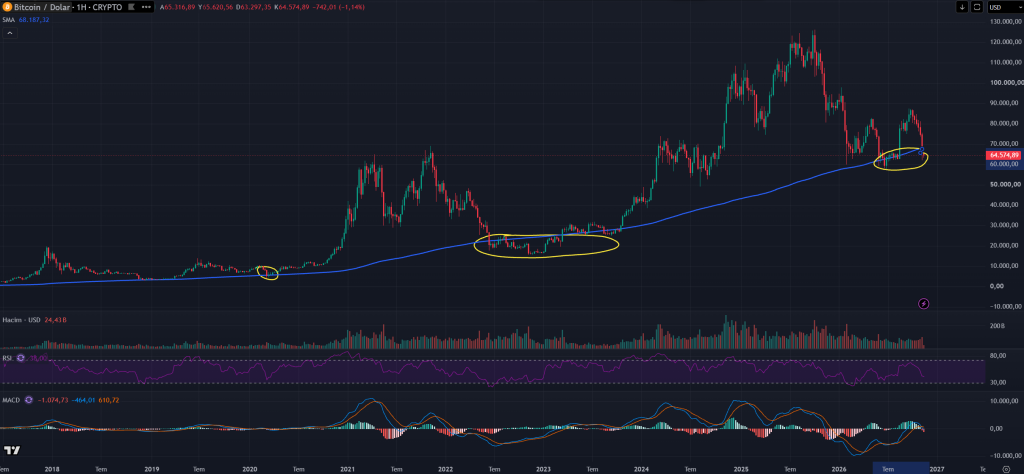
Following these periods, Bitcoin rose by 40.3%, 82.5%, and 6.3% respectively over the three-month period.
However, the recovery after June 2022 was not sustainable. The FTX crash in November of the same year created new selling pressure in the market.
In all three previous instances, it was noteworthy that Bitcoin did not immediately rebound. The price experienced a further drop of between 10% and 17% before recovering.
How Low Can It Fall?
It is stated that if a similar scenario repeats itself, Bitcoin could fall to approximately the $54,000-$59,000 range from last week’s closing price.
This prediction aligns with market maker Wintermute’s assessment that Bitcoin could fall to the $50,000 level.
Historical examples suggest that such declines can be seen in the later stages of bear markets.
However, the availability of only three historical examples makes it difficult to draw a definitive recovery signal.
It is estimated that if capital outflows from spot Bitcoin ETFs continue and US Treasury bond yields rise, selling pressure could last for more than three months.
*This is not investment advice.