


In its latest technical analysis of Bitcoin’s price, cryptocurrency analytics company Layergg highlighted critical levels, particularly on the monthly and weekly charts. The company warned that the medium- to long-term outlook carries a risk of weakening.
According to Layergg’s assessment, the previously identified uptrend criteria on Bitcoin’s monthly chart are under serious pressure. The analysis reminded that a monthly uptrend relies on three key conditions: the maintenance of the MACD golden cross, monthly candle closes above the 20 EMA and 20 MA, and the 20 EMA remaining above the 20 MA.

The company stated that the first of these conditions, the MACD golden cross, has already broken down, and the second and third conditions are at risk. Noting that the current monthly candle is fluctuating around the 20 EMA and 20 MA, Layergg said the direction is not yet clear and that the monthly closes in the first quarter of 2026 will be decisive.
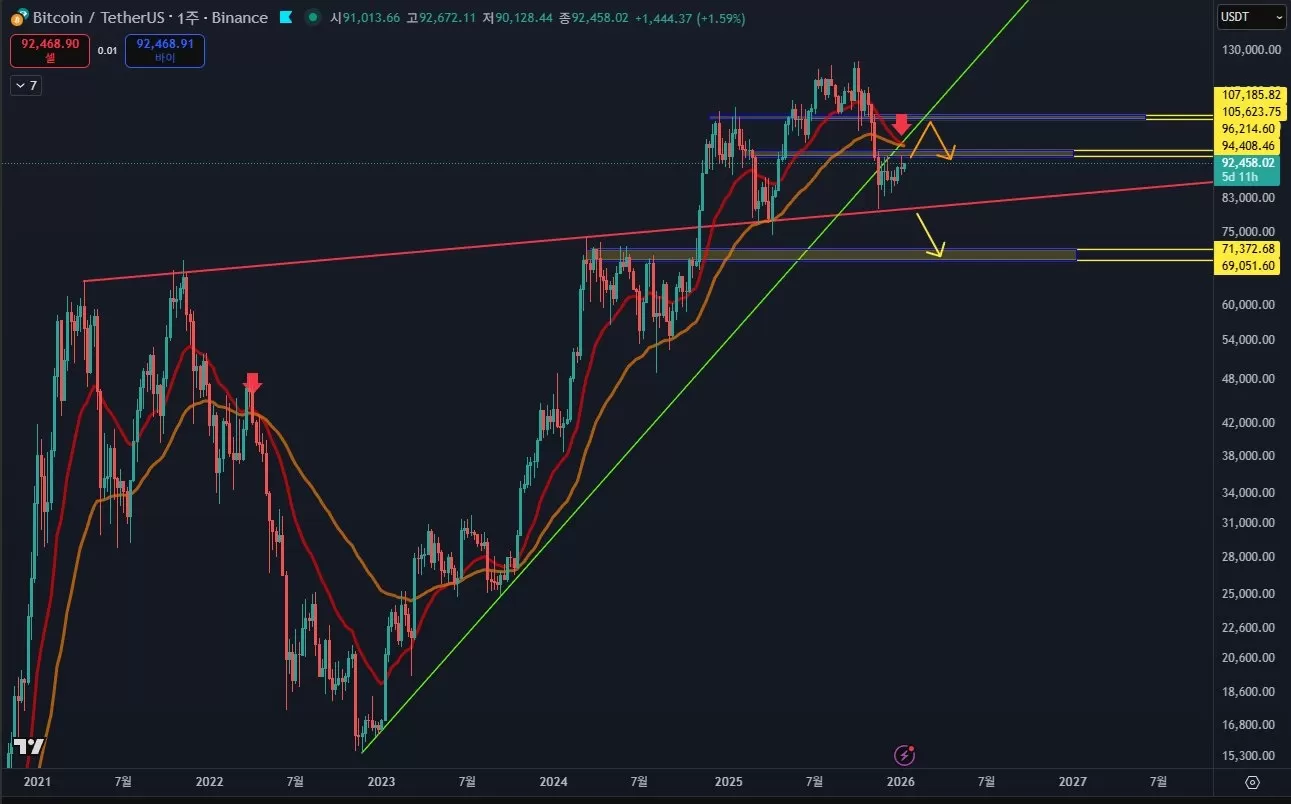
Layergg’s view is clearer on the weekly chart. According to the analysis, the weekly uptrend has been broken. For this scenario to be invalidated, Bitcoin needs to close above the $105,000-$107,000 range on a weekly basis. Otherwise, there is a risk of a “death cross” forming between the weekly 20 EMA and 50 EMA, which could prolong the downtrend. The company also noted that current price movements may resemble those of March-April 2022.
In the short term, the market is said to be in a consolidation phase. According to Layergg, the next directional move will become clear when the price breaks above the $94,000–$96,000 resistance zone or falls below the red trend line. A breakout to the upside could trigger a relief rally testing the $105,000–$107,000 range; a break to the downside, however, could pull the price back to at least the $69,000–$71,500 band.
*This is not investment advice.